Many people told me they had bought the X-Scalper, (as you know I promote X-Scalper) but they are not having great results and I really hate that 😤. They often told me the signals are not good, they have more loses that winners, etc.
Please BELIEVE me when I tell you that ALL I want is for you to become a profitable trader, so you can have the life you deserve, enjoying more free time whith your family & friends. So I want you to make MONEY, lots of MONEY, working LESS 💰💰.
So I decided to share with you some tips and recommendations on how to use X-Scalper, to have better results.
Even if you don´t use X-Scalper keep reading, I show you how to determine a trend with and without technical indicators, and give you many tips on how to trade better.
I hope it will help you.🆘
What is X-Scalper?
It is a scalping indicator (Not EA/Robot) that works on ALL pairs and M1/M5 timeframes.
Fast profit.
The "X Scalper" can help you make great stable profit if you use it correctly. But you should consider the following recommendations to start making more winning trades.
✳️Most important rule:

 Try entering only the signals that have 1 or better 2 dashed confirmation lines.
 It is also good to exit not on a new opposite signal, but on a new opposite signal that has 1 or 2 confirmation lines too.

✔️Stay away from trading on weak sideways trends.
This a very important rule, so I am going to explain the following concepts:
▪️Sideway Trend
▪️How to Determine the Trend (with & without indicators)
▪️How to Determine the Strength of the Trend
▪️Sideway Trend
▪️How to Determine the Trend (with & without indicators)
▪️How to Determine the Strength of the Trend
What is a Sideway Trend:
The sideways trend describes the horizontal price movement that occurs when the forces of supply and demand are nearly equal. A sideways trend is often regarded as a period of consolidation before the price continues in the direction of the previous move.
A sideways price trend is also commonly known as a "horizontal trend" or range.
Look at the graph below:


How to determine a trend?
There are several ways to determine a trend with and without technical indicators:No Indicators:
A trending market is one that is making higher highs followed by higher lows or lower lows followed by lower highs.

 |
| Downtrend |
Let’s start things off by just visualizing where the highs and lows on a chart have formed over a period. In short, the relationship among highs and lows as they form over time.
All we are doing with this technique is observing where the extended swing highs and lows are within a given trend.
How to Determine Trend Strength?
We need to observe the relationship between the highs & lows have with our key level (support & resistance).
The illustration below shows a trending market that is respecting an uppertrend line, however, the distance between each retest has become shorter over time.

Note how the market tested this level as support on four separate occasions since its inception. What many traders tend to dismiss, however, is the shorter time span between each retest as the trend extended higher.
The likely outcome for this type of price action is as follows:

Why does this happen?
In short, it’s the market telling you that demand is drying up. When it comes to supply and demand, as prices move higher, demand naturally begins to run thin as traders are less willing to buy at higher prices.
At the same time, supply increases as market participants unwind their positions to book profits.
In the case of the illustrations above, that demand is drying up more quickly with each subsequent rally from trend line support. Thus, we get a market that begins spending more time trying to keep its head above water than making higher highs.
Of course, this concept also applies to a bearish trend where demand increases and supply decreases as prices drop.
With Indicators
One easy way many people determine the trend is by using Moving Averages.
The simplest way is to just plot a single moving average on the chart. When price action tends to stay above the moving average, it signals that price is in a general UPTREND.
If price action tends to stay below the moving average, then it indicates that it is in a DOWNTREND.
I usually use 200 SMA.
 |
In the graph above you can see the EUR/USD in an upper trend, because the price is above the 200 SMA, once the price crossover the 200 SMA, you can determine the up trend end, and it is the beginning of a downtrend.
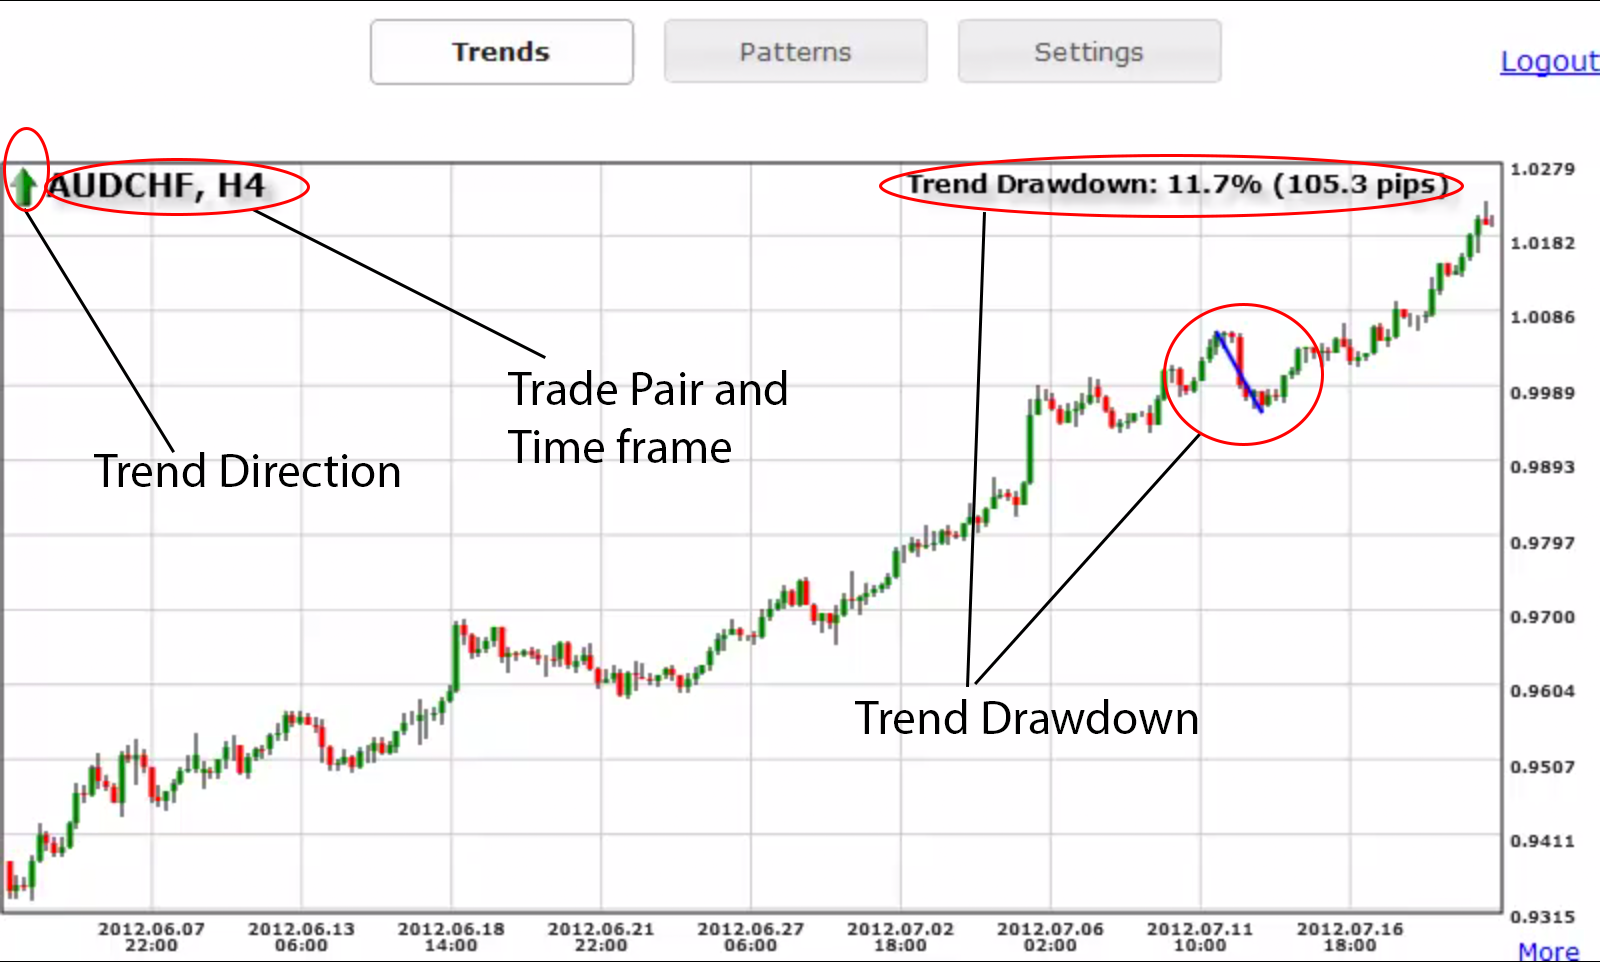
ForexTrendy
ForexTrendy is a SPECIAL TOOL that I use to find the BEST TRENDING PAIRS among all the Forex pairs.
The software scans 34 Forex pairs on all time frames from minute to monthly. This way you pick the best trending pair and time frame at the current time.
You have to pay $37 every 3 months (you can CANCEL your subscription at ANY TIME).
ADX
The ADX indicator measures the strength of a trend and can help determine if a trend is strong or weak. If the ADX numbers are higher it indicates a stronger trend and lower numbers which indicate a weaker trend.
Since we are always looking for good trends to trade, it is best to avoid trading stock, ETF’s or Forex Pairs with low ADX numbers. You would rather look for investments that have higher readings thus indicating a stronger trend.
It should be noted that the ADX indicator measures the strength of a trend not the direction of the trend either bullish or bearish. Therefore, a high ADX number could indicate either a strong uptrend or a strong downtrend.
It does not tell you if the trend is up or down, it just indicates to you how strong the current trend is.
How to interpret the ADX Scale:
If the ADX indicator is between 0 and 20 then the pair is generally in a trading range. It is likely just chopping around sideways.
Once the ADX indicator gets above 20 then you will often to see the beginning of a good trend. Big moves tend to start at about 25.
When the ADX indicator gets above 25 then you have at a pair that is in a strong trend (up or down).
If you have lower numbers, you have a trading range or the beginning of a trend.
So how do most traders use the ADX indicator?
Traders often will look for ADX values of 25 or greater to help determine a strong trend for trading. The ADX indicator is not used to give buy or sell signals. Therefore, it is generally used along with other indicators for entry and exit signals. It does, however, give you great perspective on the trend of a stock, ETF or Forex Pair. |
| ADX General # 63 Strong USD/JPY Donwtrend |
Other Considerations
If you trade on M1 - open M5, check the current intraday short trend direction, go back to M1 and only follow signals that go in the same direction with the M5 trend.
If you trade on M5-open M15, check the current intraday short trend direction, go back to M5 and only follow signals that go in the same direction with the M15 trend.
If M5 trend is up - we only follow buy signals on M1.
If M15 trend is up-we only follow buy signals on M5.
If M5 trend is down - we only follow sell signals on M1.
If M15 trend is down-we only follow sell signals on M5.
We don't trade downtrend signals if the current trend is up... just ignore those signals.
➡️Use the indicator at the "right" time only! (During UK,Asian or US session)

➡️Don't trade during major news announcements.
I always check forexfactory calendar every Sunday to check out the news for the week.
If the news is red, I avoid trading that pair for at least 1 hour before and after the news release, (specially when the news involves the FED or the Non-Farm Payrolls).

In the above example I will avoid trading the GBP pairs.
⚠️Believe me news anouncements can change the direction of the trend in seconds. Be careful⚠️
These are the most important rules for trading. If you master them - your profit will be great.
FINAL RECOMMENDATION
X-Scalper give you 60 day money back guarantee. Try it in a DEMO ACCOUNT first, and be patient.
Trying a new forex indicator and/or forex strategy, involves TIME.
Really you cannot try X Scalper 5 days and then asked for your money back.
Try it at least 45 days.
Test it in diferent pairs, at diferent times, with other technical indicators, adjust your strategy, see how you can improve your results.
Until now I have not find ANY Forex Indicator or Forex Strategy that is right 100% of the time, so don´t expect X Scalper to be that indicator.
You have 60 days to try it, test it and adjust, but please don´t expect to understand how it works in 5 days, be patient, learn from your mistakes and use a DEMO ACCOUNT.
That way you don´t lose money, and if after 50 days you decide X Scalper is not for you, ask for your money back, is easy and fast, zero problems.
Some friends asked me if the guarantee is real?
👍YES!YES!YES! is real.
The guarantee it is given by Clickbank not the creator of the product, so you can be 100% SURE you will receive your money back if you dont like the product, and yes you have 60 days to claim it, so don´t rush! 🏃🏃🏃
 |
| Get X-Scalper Here! |
Please try using the indicator with these rules and let me know of your results.
No hay comentarios:
Publicar un comentario