lunes, 26 de marzo de 2018
All the Mistakes I made Drawing Forex Trend Lines and How Do I Fix Them
Hi Maria here. Today I am going to explain a little bit more about the trend and how to use trend lines.
When I first started trading like 6 years ago, I was a complete beginner, more like a complete dummy.
I search Forex for dummies, to learn more. Why? because as I told you before I am a simple stay at home mom with 2 kids, with zero financial eduaction and I started trading forex because I was looking for ways to make money at home, and Forex is
a great option for that.
So every book or article I read all tell the same thing The Trend is your friend, Follow the Trade,
Only trade in favor of the trend never against. So I started learning about how to draw trendlines.
In theory all you have to do is locate two major tops or bottoms and connect them. Is a very simple concept but Unfortunately, most forex traders don’t draw them correctly or try to make the
line fit the market instead of the other way around.
There are three types of trends:
*Uptrend (when the price is making higher high and higher lows)
*Downtrend (when the price is making lower highs and lower lows)
*Sideways trends (when the price is a range)
It takes at least two tops or bottoms to draw a valid trend line but it takes THREE to confirm a trend line.
The STEEPER the trend line you draw, the less reliable it is going to be and the more likely it will break.
Like horizontal support and resistance levels, trend lines become stronger the more times they are tested.
And most importantly, DO NOT EVER draw trend lines by forcing them to fit the market.
If they do not fit right, then that trend line isn’t a valid one!
So why do you need to know how to draw a good trend line?
Because is true! Trend lines are probably the most common form of technical analysis in forex trading.
They are probably one of the most underutilized ones as well.
If drawn correctly, they can be as accurate as any other method.
And they can increase the profitability of any system.
No matter which system do you use.
When I started I used this simple system:
I only use 2 indicators
*The Simple Moving Average 5 which is the blue line and Simple Moving Average 20 the red line
Just 2 rules
1. I buy when the blue line crosses the red line upwards and
2. I sell when the blue line crosses the red line downwards
Simple, very simple
And a great system too but this simple system requieres a strong trend market
How did I solved my Forex Trading problems?
With this AMAZING ebook "Understanding the Myths of Trends and Chart Patterns"
The book has 2 sections the first section is all about trends
In this section you will learn
*The Myth of Market Trend
*How to Increase the Profitability of Any System
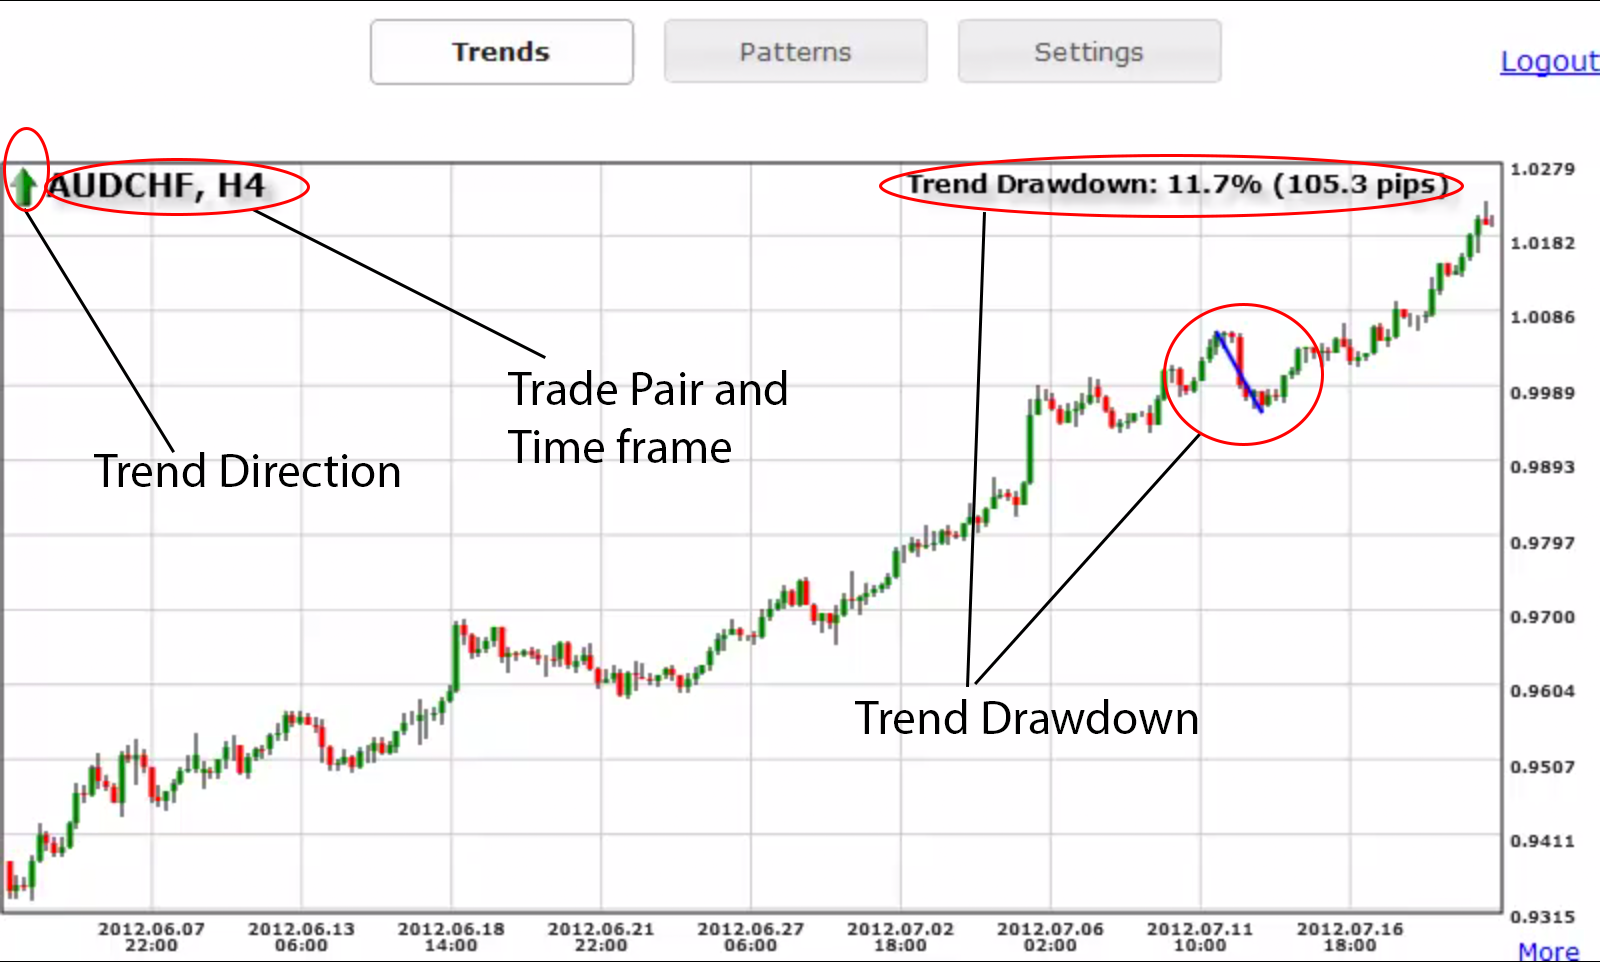
*How to Determine the Trend
*What is a Trend Drawdown
*Protecting Against Volatility
*Exercise
*The Ultimate Solution
and the second section is all about patterns
*How to Draw Trend Lines
*Examples: Good Trend Lines vs. Bad Trend Lines
*Triangles, Flags, Wedges
*How to Trade Chart Patterns
*Exercise
*Recognizing Chart Patterns
Really this book change the way I approach forex trading and really open my eyes on why I was not making consistent profits all I need was to determine a strong trending pair to apply my strategy.
I hope this video help you so check out the book is completely free but believe me it will help you a lot.
== Get your Free Copy Here http://bit.ly/2G7Xy4m
Social Media
Blog http://money-bubu.blogspot.com
FB: Fxmegaforex and/or forexmegatrion
Instagram Maria Galindo/forexess
Twitter: @bichiz
Google+: Maria Galindo
Todos los errores que cometí al Determinar la Tendencia en Forex y Cómo ...
Hola María aquí. Hoy voy a explicarte un poco más acerca de la tendencia y cómo usar las líneas de tendencia en forex.
Cuando comencé a operar Forex hace como 6 años, era completamente nueva, más como dirían en inglés dummy.
Yo buscaba en Google Forex para Dummies, para aprender más. ¿Por qué? Porque ya he dicho varias veces yo soy simplemente una ama de casa, con 2 hijos que empezó a operar en Forex por casualidad, buscando formas de hacer dinero desde casa. Y forex es una excelente manera de hacer esto.
== Obtén la copia gratis del libro aquí http://bit.ly/2G7Xy4m
Así que cada libro o artículo que leía decía lo mismo "La tendencia en Forex es tu amiga" "Sigue la tendenica" "Opera siempre a favor de la tendenica nuna en contra". Así que empecé a aprender acerca de como dibujar líneas de tendencia.
En teoría todo lo que tienes que hacer es localizar 2 topes o 2 suelos mayores y conectarlos. Es un concepto muy simple pero desafortunadamente muchos operadores de forex no pueden dibujar correctamente una línea de tendencia o quiere ajustar la línea de tendencia al mercado y no al revés!
Hay tres tipos de tendencia:
1. Tendencia alcista (el precio hace altos más altos y bajos más altos).
2. Bajista (el precio hace altos más bajos y bajos más bajos).
3. Rango (el precio respeta los soportes y resistencias).
Se necesitan por lo menos dos topes o suelos para dibujar una línea de tendencia pero se necesitan TRES para confirmar la tendencia.
Entre más delgada la línea de tendencia que dibujas, menos confiables va hacer y más rápido se puede romper.
Como las líneas horizontales de soportes y resistencias, las líneas de tendencia entre más veces son probadas más fuertes se vuelven.
== Obtén una copia gratis del libro aquí http://bit.ly/2G7Xy4m
Y lo más importante NUNCA, PERO NUNCA, dibujes líneas de tendencia forzándolas a ajustarse al mercado.
Si no se ajustan correctamente, entonces la línea de tendencia no es valida!
Entonces ¿por qué necesitas saber cómo dibujar buenas líneas de tendencia?
Porque es cierto! Las líneas de tendencia son probablemente la forma más común de hacer un análisis técnico en forex.
Son probablemente una de las herramientas menos utilizadas también.
Si son dibujadas correctamente pueden ser muy precisas igual que cualquier otro método.
Y pueden DEFINITIVAMENTE incrementar las ganancias de cualquier sistema y estrategia de forex que uses.
Sin importar que sistema o estrategia uses.
Cuando comencé a operar usaba un sistema muy simple:
Mi estrategia era utilizar solamente 2 indicadores:
*Moving Average 5 (línea azul)
*Moving Average 20 (línea roja)
Sólo 2 reglas:
1. Comprar cuando la línea azul atraviese por arriba la línea roja
2. Vender cuando la línea azul atraviese por abajo la línea roja.
Simple muy simple!
== Obtén copia de tu libro gratis aquí http://bit.ly/2G7Xy4m
Y una gran estrategia también pero está simple estrategia solamente funciona en pares que estén operando con tendencias fuertes.
¿Cómo resolví mis problemas con la Tendencia en Forex?
Con este increíble ebook "Understanding the Myths of Trends and Chart Patterns" (está en inglés)
== Obtén tu copia gratis aquí http://bit.ly/2G7Xy4m
El libro tiene 2 secciones: La primera es todo acerca de las tendencias:
En está sección vas a aprender:
*El mito sobre los mercados de tendencias
*Cómo incrementar las ganancias con cualquier estrategia y sistema
*Como determinar la tendencia
*Qué es Drawdown
*Protegerse contra la volatilidad
*Ejercicio
*La Solución última
== Obtén la copia del libro gratis aquí http://bit.ly/2G7Xy4m
2 Sección: Patrones en las Gráficas
*Cómo dibujar bien las líneas de tendencias
*Ejemplos de buenas líneas vs malas líneas
*Triángulos, Banderas, Cuyas
*Cómo Operar Patrones de la Gráfica
*Ejercicio
*Reconociendo los Patrones en las Gráficas
Realmente este libro cambio mi manera de operar y ver las gráficas en Forex e hizo que mis ganancias al operar se volvieran consistentes. Abrió mis ojos al darme cuenta que mi estrategia y sistema eran correctos pero los aplicaba en un mercado incorrecto debía buscar un par estuviera operando en un mercado de tendencia fuerte.
Espero esté vídeo y el libro te ayuden tanto como lo hizo conmigo. En serio aprovecha el libro, es gratuito, solo debes ir al enlace y listo.
== Obtén una copia del libro gratis aquí http://bit.ly/2G7Xy4m
Redes Sociales
Blog http://money-bubu.blogspot.com
FB: Fxmegaforex and/or forexmegatrion
Instagram Maria Galindo/forexess
Twitter: @bichiz
Google+: Maria Galindo
Linkedin: Maria Galindo
lunes, 12 de marzo de 2018
What Exactly is Ripple Coin-Cryptocurrency on the Rise
Ripple is more of a protocol than a cryptocurrency. Now, this may sound a little confusing at first, but it really is an ingenious idea.
The Ripple protocol was specifically designed to use blockchain technology in a way that makes transferring money anywhere around the world nearly instantaneous and inexpensive.
It's arguably the fastest and most frictionless cryptocurrency when it comes to completing any transaction through the use of its digital token, XRP.
It's insanely secure, too, which is why numerous banks and other financial institutions around the globe have taken to using the revolutionary crypto.
Ranked as the third-most valuable digital asset and used by more banks and institutions around the globe, Ripple has made more progress toward mainstream acceptance than any other cryptocurrency.
➡More about how to invest in Cryptocurrencies enter here http://bit.ly/2FKmCkV
But there are other cryptocurrencies out there, a fraction of the size of Bitcoin and Ethereum, that house the potential to pave their own way in the crypto world just like Ripple did before them.
My colleague David Robertson has spent months unearthing those "microcap" cryptocurrencies that have similar latent abilities waiting to break loose.
Like NEM, Stellar, Tron, Cardamo, etc.
➡More about how to invest in Cryptocurrencies enter here http://bit.ly/2FKmCkV
Introducing Crypto Members Club
This is David monthly cryptocurrency trading report – and guide to his own personal portfolio.
He will never tell you about a currency that he is not personally investing in.
He will never recommend a loser coin.
He will be with you every step of the way.
Here to help you get started, buy, sell and cash out your winnings.
As a Crypto Members Club subscriber you will receive...
Reports, including David exact picks to buy and sell, in real-time.
• The latest market analysis and commentary.
• What David is personally buying and selling
• Unlimited access to David via email, on hand to answer any questions you may have.
➡More about how to invest in Cryptocurrencies enter here http://bit.ly/2FKmCkV
Crypto Members Club takes the guesswork out of investing...
And gives you the opportunity to trade alongside David as he continue to build his hugely successful portfolio.
In many cases, this is not about holding on to currency for years to come.
It’s about making the right investment, watching it grow and selling at the perfect time.
Using this unique system, you will know about a handful of winners every month…
...and this knowledge may very well help you become a crypto millionaire.
David will help you learn about investing – and even how to make investments.
Don't worry, it's very straight-forward, you just need a little expert guidance from David.
I promise you that you don’t need a ton of money...
➡More about how to invest in Cryptocurrencies enter here http://bit.ly/2FKmCkV
You just need to be smart, committed, and ready to do the work – and if you are, you’ll have everything you need to turn $20 into $27,525 – or more…
Even if the Crypto Members Club doesn't you a millionaire overnight, just remember this...
If you make a single profitable trade, it’s paid for itself – and your $27 has become $1,000, $5,000, $10,000 or more – that’s a significant return on investment.
➡More about how to invest in Cryptocurrencies enter here http://bit.ly/2FKmCkV
Social Media
FB: Fxmegaforex and/or Forexmegatrion
Twitter: @bichiz
Linkedin: Maria Galindo
Google+: Maria Galindo
Instagram: Maria Galindo/forexess
Blog: https://money-bubu.blogspot.com
Investing the financial markets, including cryptocurrencies, involves high risk, never invest money you cannot afford to lose.
jueves, 1 de marzo de 2018
Here is a Quick Way to Solve Your Problems with X-Scalper
Hi María here!
Many people told me they had bought the X-Scalper, (as you know I promote X-Scalper) but they are not having great results and I really hate that 😤. They often told me the signals are not good, they have more loses that winners, etc.
Please BELIEVE me when I tell you that ALL I want is for you to become a profitable trader, so you can have the life you deserve, enjoying more free time whith your family & friends. So I want you to make MONEY, lots of MONEY, working LESS 💰💰.
So I decided to share with you some tips and recommendations on how to use X-Scalper, to have better results.
Even if you don´t use X-Scalper keep reading, I show you how to determine a trend with and without technical indicators, and give you many tips on how to trade better.
I hope it will help you.🆘
It is a scalping indicator (Not EA/Robot) that works on ALL pairs and M1/M5 timeframes.
Fast profit.

 Try entering only the signals that have 1 or better 2 dashed confirmation lines.
It is also good to exit not on a new opposite signal, but on a new opposite signal that has 1 or 2 confirmation lines too.

A sideways price trend is also commonly known as a "horizontal trend" or range.
No Indicators:
A trending market is one that is making higher highs followed by higher lows or lower lows followed by lower highs.


If you trade on M5-open M15, check the current intraday short trend direction, go back to M5 and only follow signals that go in the same direction with the M15 trend.
If M5 trend is up - we only follow buy signals on M1.
If M15 trend is up-we only follow buy signals on M5.
If M5 trend is down - we only follow sell signals on M1.
If M15 trend is down-we only follow sell signals on M5.
We don't trade downtrend signals if the current trend is up... just ignore those signals.
➡️Use the indicator at the "right" time only! (During UK,Asian or US session)

➡️Don't trade during major news announcements.
I always check forexfactory calendar every Sunday to check out the news for the week.
If the news is red, I avoid trading that pair for at least 1 hour before and after the news release, (specially when the news involves the FED or the Non-Farm Payrolls).

In the above example I will avoid trading the GBP pairs.
⚠️Believe me news anouncements can change the direction of the trend in seconds. Be careful⚠️
These are the most important rules for trading. If you master them - your profit will be great.
X-Scalper give you 60 day money back guarantee. Try it in a DEMO ACCOUNT first, and be patient.
Trying a new forex indicator and/or forex strategy, involves TIME.
Really you cannot try X Scalper 5 days and then asked for your money back.
Try it at least 45 days.
Test it in diferent pairs, at diferent times, with other technical indicators, adjust your strategy, see how you can improve your results.
Until now I have not find ANY Forex Indicator or Forex Strategy that is right 100% of the time, so don´t expect X Scalper to be that indicator.
You have 60 days to try it, test it and adjust, but please don´t expect to understand how it works in 5 days, be patient, learn from your mistakes and use a DEMO ACCOUNT.
That way you don´t lose money, and if after 50 days you decide X Scalper is not for you, ask for your money back, is easy and fast, zero problems.
Some friends asked me if the guarantee is real?
👍YES!YES!YES! is real.
The guarantee it is given by Clickbank not the creator of the product, so you can be 100% SURE you will receive your money back if you dont like the product, and yes you have 60 days to claim it, so don´t rush! 🏃🏃🏃
Please try using the indicator with these rules and let me know of your results.
Many people told me they had bought the X-Scalper, (as you know I promote X-Scalper) but they are not having great results and I really hate that 😤. They often told me the signals are not good, they have more loses that winners, etc.
Please BELIEVE me when I tell you that ALL I want is for you to become a profitable trader, so you can have the life you deserve, enjoying more free time whith your family & friends. So I want you to make MONEY, lots of MONEY, working LESS 💰💰.
So I decided to share with you some tips and recommendations on how to use X-Scalper, to have better results.
Even if you don´t use X-Scalper keep reading, I show you how to determine a trend with and without technical indicators, and give you many tips on how to trade better.
I hope it will help you.🆘
What is X-Scalper?
It is a scalping indicator (Not EA/Robot) that works on ALL pairs and M1/M5 timeframes.
Fast profit.
The "X Scalper" can help you make great stable profit if you use it correctly. But you should consider the following recommendations to start making more winning trades.
✳️Most important rule:

 Try entering only the signals that have 1 or better 2 dashed confirmation lines.
 It is also good to exit not on a new opposite signal, but on a new opposite signal that has 1 or 2 confirmation lines too.

✔️Stay away from trading on weak sideways trends.
This a very important rule, so I am going to explain the following concepts:
▪️Sideway Trend
▪️How to Determine the Trend (with & without indicators)
▪️How to Determine the Strength of the Trend
▪️Sideway Trend
▪️How to Determine the Trend (with & without indicators)
▪️How to Determine the Strength of the Trend
What is a Sideway Trend:
The sideways trend describes the horizontal price movement that occurs when the forces of supply and demand are nearly equal. A sideways trend is often regarded as a period of consolidation before the price continues in the direction of the previous move.
A sideways price trend is also commonly known as a "horizontal trend" or range.
Look at the graph below:


How to determine a trend?
There are several ways to determine a trend with and without technical indicators:No Indicators:
A trending market is one that is making higher highs followed by higher lows or lower lows followed by lower highs.

 |
| Downtrend |
Let’s start things off by just visualizing where the highs and lows on a chart have formed over a period. In short, the relationship among highs and lows as they form over time.
All we are doing with this technique is observing where the extended swing highs and lows are within a given trend.
How to Determine Trend Strength?
We need to observe the relationship between the highs & lows have with our key level (support & resistance).
The illustration below shows a trending market that is respecting an uppertrend line, however, the distance between each retest has become shorter over time.

Note how the market tested this level as support on four separate occasions since its inception. What many traders tend to dismiss, however, is the shorter time span between each retest as the trend extended higher.
The likely outcome for this type of price action is as follows:

Why does this happen?
In short, it’s the market telling you that demand is drying up. When it comes to supply and demand, as prices move higher, demand naturally begins to run thin as traders are less willing to buy at higher prices.
At the same time, supply increases as market participants unwind their positions to book profits.
In the case of the illustrations above, that demand is drying up more quickly with each subsequent rally from trend line support. Thus, we get a market that begins spending more time trying to keep its head above water than making higher highs.
Of course, this concept also applies to a bearish trend where demand increases and supply decreases as prices drop.
With Indicators
One easy way many people determine the trend is by using Moving Averages.
The simplest way is to just plot a single moving average on the chart. When price action tends to stay above the moving average, it signals that price is in a general UPTREND.
If price action tends to stay below the moving average, then it indicates that it is in a DOWNTREND.
I usually use 200 SMA.
 |
In the graph above you can see the EUR/USD in an upper trend, because the price is above the 200 SMA, once the price crossover the 200 SMA, you can determine the up trend end, and it is the beginning of a downtrend.
ForexTrendy
ForexTrendy is a SPECIAL TOOL that I use to find the BEST TRENDING PAIRS among all the Forex pairs.
The software scans 34 Forex pairs on all time frames from minute to monthly. This way you pick the best trending pair and time frame at the current time.
You have to pay $37 every 3 months (you can CANCEL your subscription at ANY TIME).
ADX
The ADX indicator measures the strength of a trend and can help determine if a trend is strong or weak. If the ADX numbers are higher it indicates a stronger trend and lower numbers which indicate a weaker trend.
Since we are always looking for good trends to trade, it is best to avoid trading stock, ETF’s or Forex Pairs with low ADX numbers. You would rather look for investments that have higher readings thus indicating a stronger trend.
It should be noted that the ADX indicator measures the strength of a trend not the direction of the trend either bullish or bearish. Therefore, a high ADX number could indicate either a strong uptrend or a strong downtrend.
It does not tell you if the trend is up or down, it just indicates to you how strong the current trend is.
How to interpret the ADX Scale:
If the ADX indicator is between 0 and 20 then the pair is generally in a trading range. It is likely just chopping around sideways.
Once the ADX indicator gets above 20 then you will often to see the beginning of a good trend. Big moves tend to start at about 25.
When the ADX indicator gets above 25 then you have at a pair that is in a strong trend (up or down).
If you have lower numbers, you have a trading range or the beginning of a trend.
So how do most traders use the ADX indicator?
Traders often will look for ADX values of 25 or greater to help determine a strong trend for trading. The ADX indicator is not used to give buy or sell signals. Therefore, it is generally used along with other indicators for entry and exit signals. It does, however, give you great perspective on the trend of a stock, ETF or Forex Pair. |
| ADX General # 63 Strong USD/JPY Donwtrend |
Other Considerations
If you trade on M1 - open M5, check the current intraday short trend direction, go back to M1 and only follow signals that go in the same direction with the M5 trend.
If you trade on M5-open M15, check the current intraday short trend direction, go back to M5 and only follow signals that go in the same direction with the M15 trend.
If M5 trend is up - we only follow buy signals on M1.
If M15 trend is up-we only follow buy signals on M5.
If M5 trend is down - we only follow sell signals on M1.
If M15 trend is down-we only follow sell signals on M5.
We don't trade downtrend signals if the current trend is up... just ignore those signals.
➡️Use the indicator at the "right" time only! (During UK,Asian or US session)

➡️Don't trade during major news announcements.
I always check forexfactory calendar every Sunday to check out the news for the week.
If the news is red, I avoid trading that pair for at least 1 hour before and after the news release, (specially when the news involves the FED or the Non-Farm Payrolls).

In the above example I will avoid trading the GBP pairs.
⚠️Believe me news anouncements can change the direction of the trend in seconds. Be careful⚠️
These are the most important rules for trading. If you master them - your profit will be great.
FINAL RECOMMENDATION
X-Scalper give you 60 day money back guarantee. Try it in a DEMO ACCOUNT first, and be patient.
Trying a new forex indicator and/or forex strategy, involves TIME.
Really you cannot try X Scalper 5 days and then asked for your money back.
Try it at least 45 days.
Test it in diferent pairs, at diferent times, with other technical indicators, adjust your strategy, see how you can improve your results.
Until now I have not find ANY Forex Indicator or Forex Strategy that is right 100% of the time, so don´t expect X Scalper to be that indicator.
You have 60 days to try it, test it and adjust, but please don´t expect to understand how it works in 5 days, be patient, learn from your mistakes and use a DEMO ACCOUNT.
That way you don´t lose money, and if after 50 days you decide X Scalper is not for you, ask for your money back, is easy and fast, zero problems.
Some friends asked me if the guarantee is real?
👍YES!YES!YES! is real.
The guarantee it is given by Clickbank not the creator of the product, so you can be 100% SURE you will receive your money back if you dont like the product, and yes you have 60 days to claim it, so don´t rush! 🏃🏃🏃
 |
| Get X-Scalper Here! |
Please try using the indicator with these rules and let me know of your results.
Suscribirse a:
Entradas (Atom)