👊My Forex Strategy using Pips Wizard Pro👊
3 Rules you MUST follow when using Pips Wizard Pro:
1. Never use Pips Wizard Pro in a Flat Market
2. Never trade against the trend
3. Always trade in trend markets, never in a sideways market.
More on how to use Pips Wizard Pro ENTER HERE.
I followed the rules, but I add the following indicators to create my own forex strategy.
1. Stochastics
2. ADX
3. Support, Resistance and Pivot Lines
🆓If you want a FREE Support and Resistance Indicator just send me an email and I will send you the link🆓
How do I analyze the graphic?
1. Wait for a Blue (Buy) or Orange (Sell) Diamond (Pips Wizard Pro)
2. Once Pips Wizard Pro show me a Diamond, I look at the graphic and look for the following:
For example:
Pips Wizard Pro, sent a sell signal, I look at the stochastics and see if it is in the overbought level, and the strength of the trend (ADX) if it is above 25 I know the trend is strong.
Then I see if the price is at a resistence level. If everything is right I will open a sell position.

The first trade:
The GBP/JPY met all the criteria.
It was at a resistance level, the stochastics was in overbought level and the diamond was orange.
It was a great signal +244 pips
The moment the blue diamond appeared I closed the position. Because it meant the trend had changed and also the stochastics was in oversold level.
The second sell signal 👇👇
Was another AMAZING signal +307 pips but I did not opened the trade.
Why?
Because the conditions were not met. The stochastics continue in a oversold level, so I did not opened.
I missed a GREAT opportunity, but I tried to always follow my trading rules.
 |
| 📌📌More Infomation about Pips Wizard Pro ENTER HERE📌📌 |
The Third Signal 👆👆
Now it appear a Blue Diamond, I also did not opened the trade.
Why?
Because once again the conditions were not met.
The stochastics was in an overbought level & the trend was down.
But you can see the price was near a support level (so thats why the signal was a buy).
And once again it was a GREAT signal, +164 pips so far, that I missed, but I had learned the bad way (losing money) to follow the rules, even if you maybe missed some good opportunities, like the above examples.
But in the ONLY trade I opened I gained +244 pips, making $244 in profit, not bad at all!
📌Pips Wizard Pro gave 3 Amazing signals +715 pips so far. 📌
Now you know how do I analyze the graphic using Pips Wizard Pro.
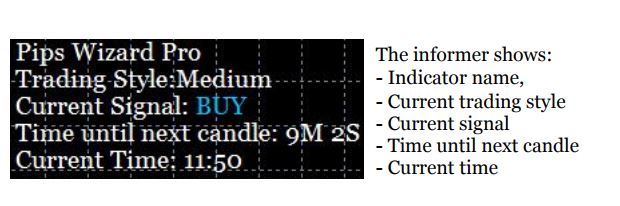
Just one more thing Pips Wizard Pro, send a Forex Signal (Push Alerts, Email or Mobile) sometimes and sometimes, it ONLY appear the diamond in the graphic.
But I analyze and open the trades, even the ones send, the same way, I follow my own rules no matter what.
 |
| Push Alert |
 |
| Only in the Graphic |
Leave me your comments on how do you analyze your graphic.
No hay comentarios:
Publicar un comentario